Kalan Ferguson
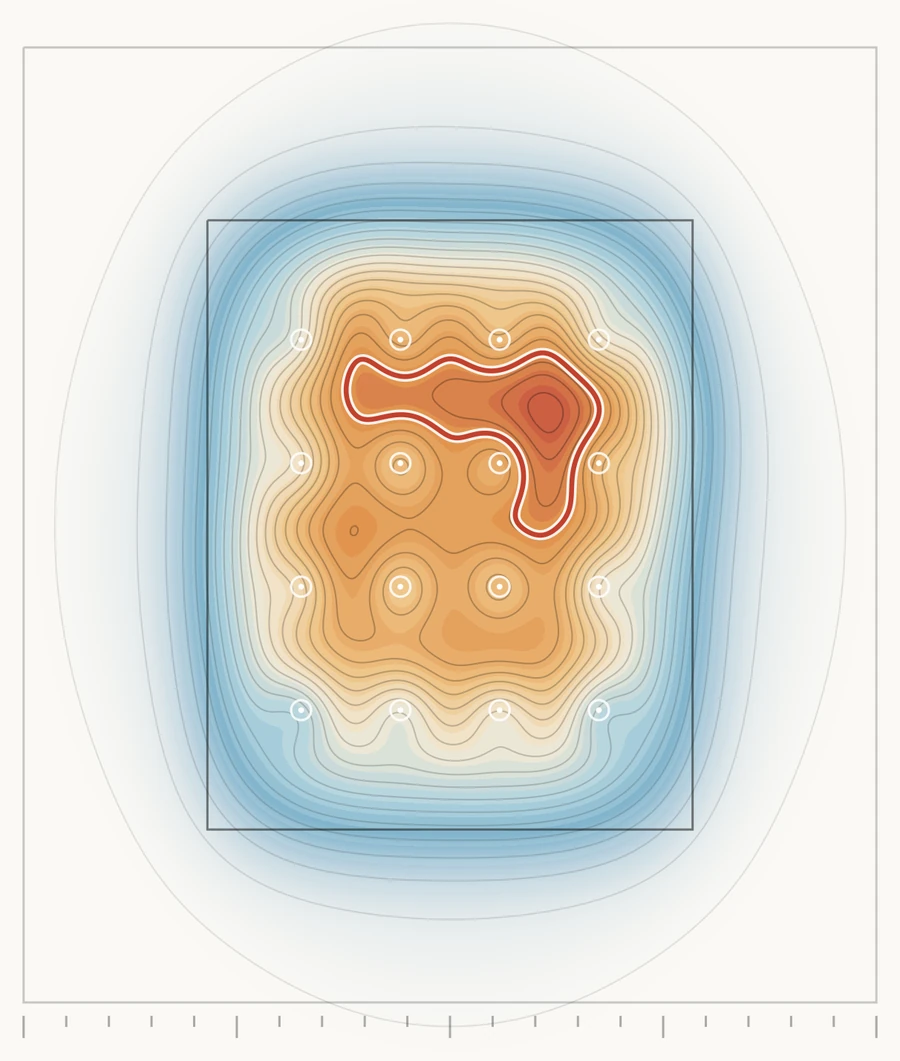
Contour map of case temperature across a GPU die under a grid of 16 jet nozzles: blue at the die edge, orange towards the centre, and a hotspot outlined in red where the case temperature exceeds its limit
EGH404 Research in Engineering Practice, research proposal

Where single-phase cooling runs out

A boundary-consistent comparison of single- and two-phase direct-to-chip liquid cooling for AI accelerator racks above 200 kW.

Kalan Ferguson, Queensland University of Technology, October 2026

Proposal stage. The literature review, method and evaluation plan are complete. The preliminary analysis runs on a synthetic dataset; no experiment has been carried out yet.

Validated today
52 kW per rack
Needed next
180 to 220 kW
Proposed test matrix
270 runs, 3 scales
Deliverable
A measured P* map

Introduction

Single-phase cooling is validated to 52 kW per rack. Next-generation racks need 180 to 220 kW.

Topic
Direct-to-chip liquid cooling of AI accelerators. A cold plate on each GPU carries heat away by warming a liquid (single-phase) or boiling a refrigerant (two-phase).
Problem
Single-phase is the only mode validated at rack scale (Heydari et al., 2024). Two-phase has been tested only at chip and channel scale, with incompatible metrics (Lee et al., 2026; Morse et al., 2021). The limit of single-phase cannot yet be quantified.
Questions
RQ1At what GPU power and coolant condition does single-phase cooling exceed its case-temperature limit, measured on the same boundary as two-phase? RQ2Does two-phase extend that limit at rack scale without dryout or flow maldistribution?
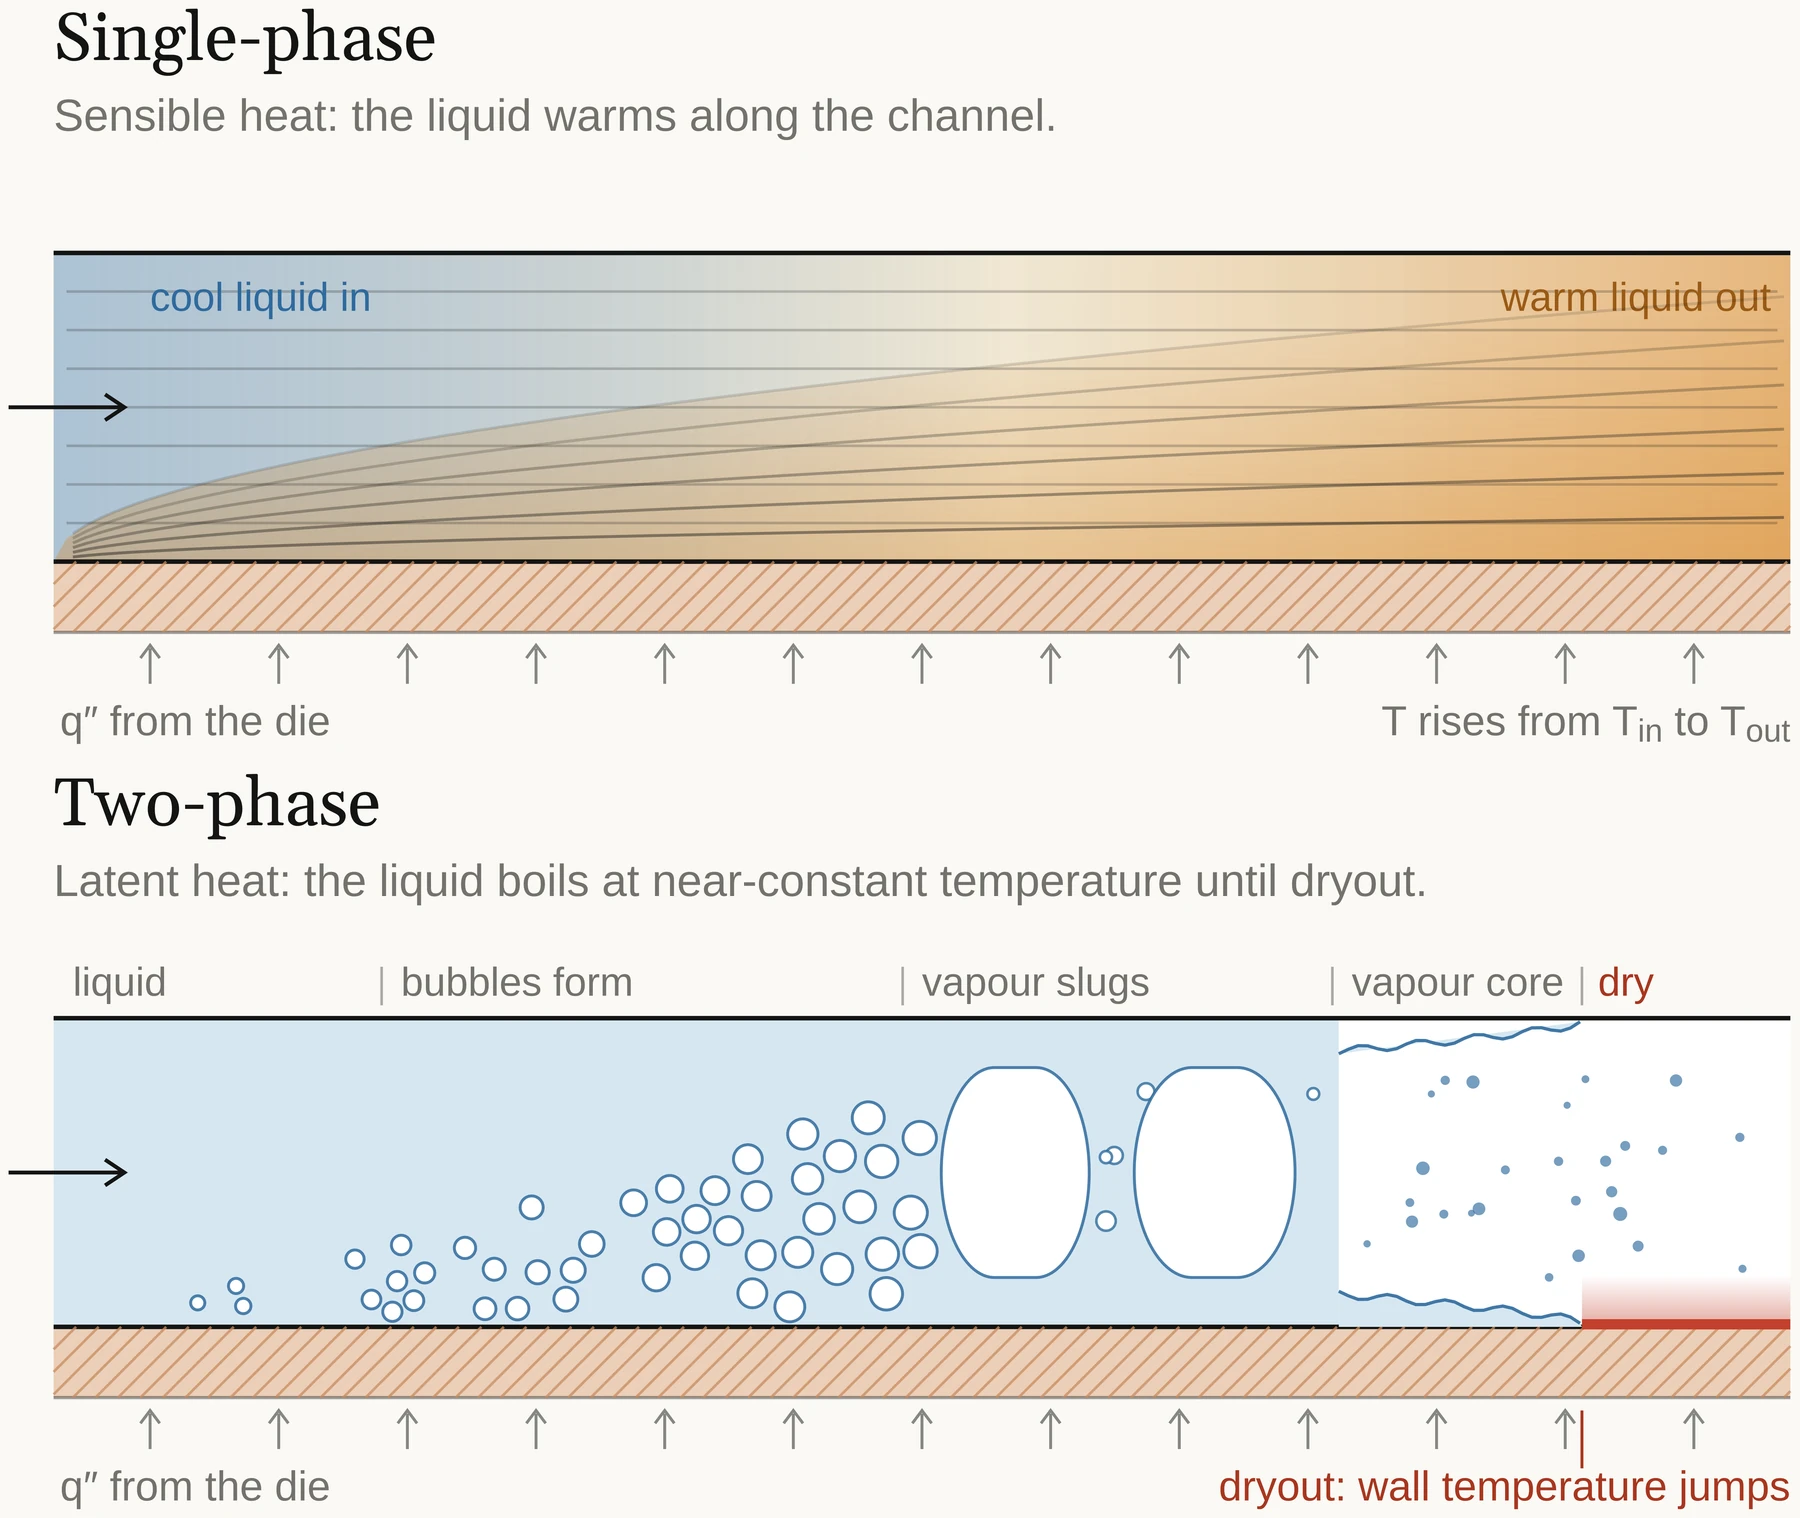
Two cold-plate channel sections. Single-phase: cool liquid enters and warms along the channel as heat flows up from the die. Two-phase: liquid boils into bubbles, vapour slugs and a vapour core, and at the end the wall film dries out and wall temperature jumps.
Single-phase carries sensible heat: the liquid warms along the channel. Two-phase carries latent heat at near-constant temperature until the wall film dries out, where wall temperature jumps (red).

Literature review

No study compares both modes on one boundary above package scale.

ScaleMetric reportedSingle-phaseTwo-phase
RackHeat capture ratio; CDU effectivenessHeydari et al. (2024). Three racks, about 52 kW per rack, 94% of heat captured by liquid.No published data.The cell this proposal fills.
PackageThermal resistance, K/WLee et al. (2026). 0.032 K/W at about 1 kW. Wu et al. (2025): 3,000 W/cm².Lee et al. (2026). Resistance 8.7% higher; energy efficiency 78% better. Drummond et al. (2018): 910 W/cm².
ChannelDryout fraction, % of critical heat fluxClassical correlations. Dittus-Boelter forced convection (Incropera et al., 2007).Morse et al. (2021). Dryout begins at about 90% of critical heat flux; the heat-transfer coefficient peaks just before it.

Each study draws its boundary at a different scale and reports a different metric, and the verdict flips with the metric (Lee et al., 2026).

My literature review found the apparent superiority of two-phase cooling is largely an artefact of mismatched scales and metrics. On Lee et al.'s same-rig comparison, single-phase leads on thermal resistance by 8.7% while two-phase leads on energy efficiency by 78%. The better architecture depends on the framework applied, not only the physics.

Two-phase also carries a failure mode single-phase does not. Its best heat transfer sits right next to dryout, so operating near its optimum means accepting a margin to a discontinuity. Nobody has located that margin at chip-relevant heat flux, or tested two-phase flow distribution across a rack.
Motivation, rationale and objectives

Rack heat load now exceeds the validated evidence by 3.5 to 4.2 times.

Bar chart of rack heat load: the largest validated rack test is 52 kW; GB200 and GB300 racks need 120 to 140 kW; Vera Rubin NVL72 racks need 180 to 220 kW, 3.5 to 4.2 times the largest test. Largest validated rack (Heydari et al., 2024) 52kW GB200 / GB300 today 120 to 140kW Vera Rubin NVL72, next (Chu et al., 2026) 180 to 220 Unvalidated: 3.5 to 4.2 times the largest rack-scale test
Bars to scale, 0 to 220 kW. Roadmaps approach 1 MW per rack, and thermal management already draws about 40% of data-centre electricity (Wu et al., 2025).

Objectives

  1. One boundary and one metric set for both modes.
  2. Measure the single-phase limit P* across power, flow and inlet temperature.
  3. Test whether two-phase extends P* at rack-slice and full-rack scale.
Hypothesis

Two-phase holds Tcase below 90 °C beyond the single-phase P*, at equal or lower pumping power.

Methods

One control volume, measured at three scales.

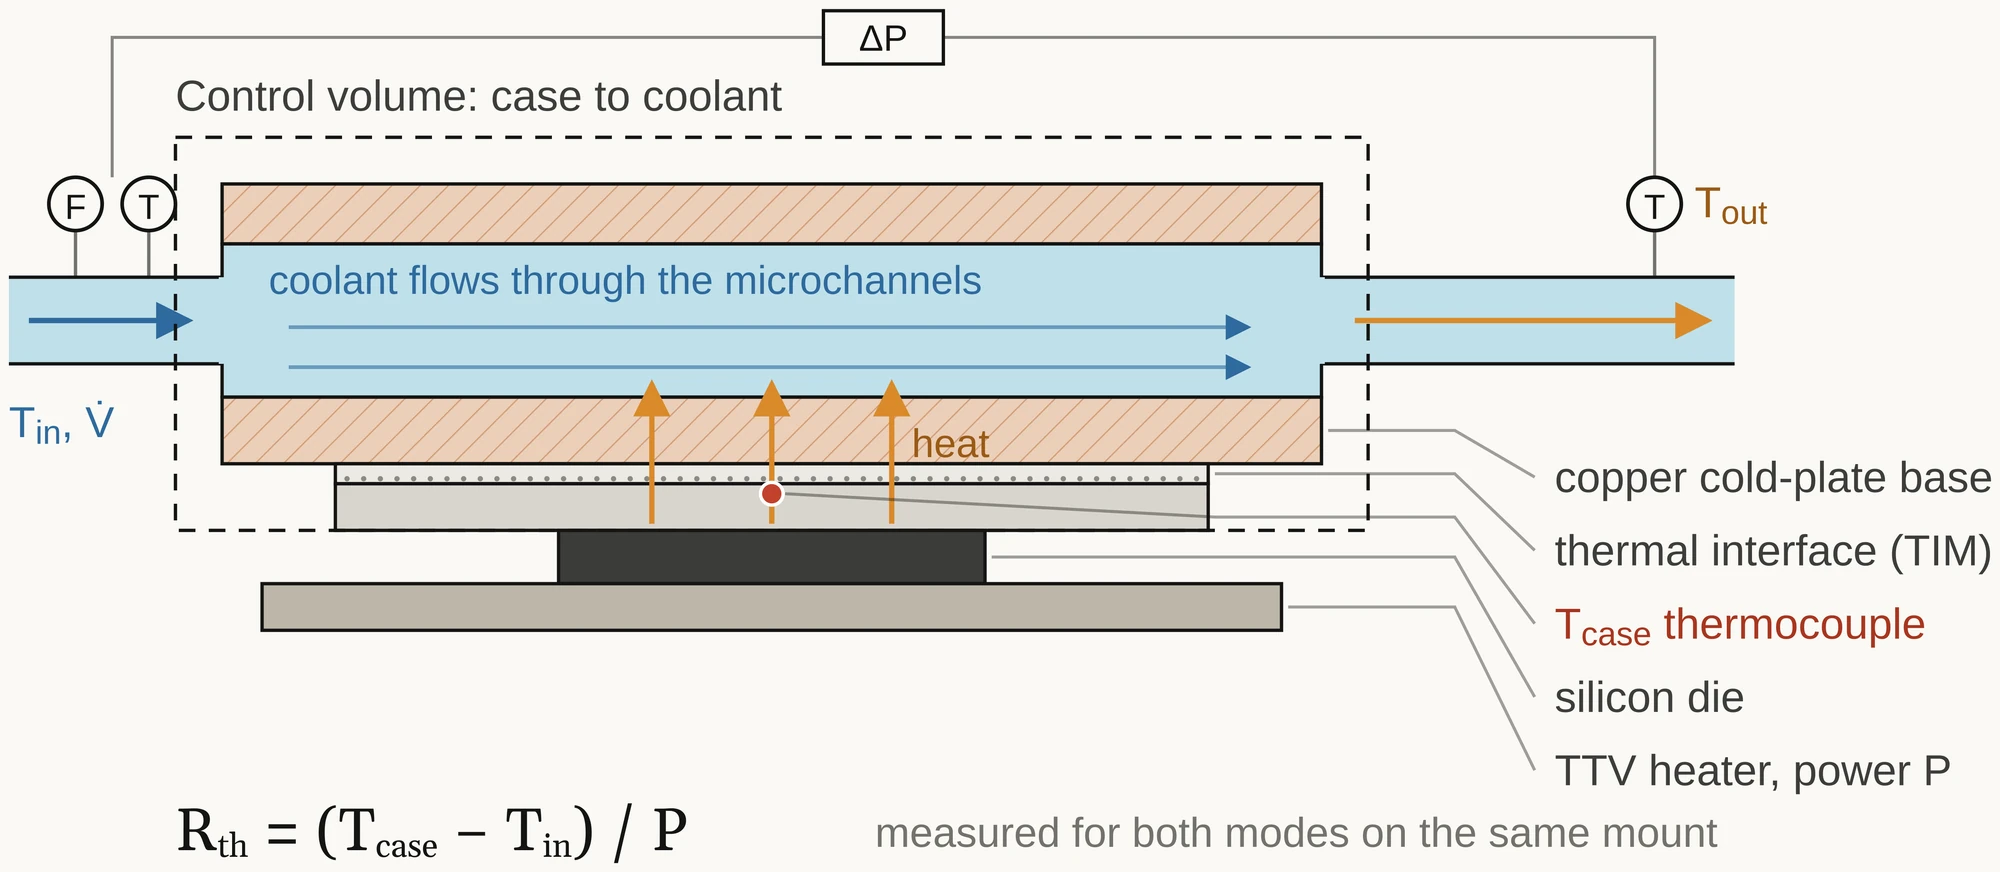
Section through the test stack: coolant flows through microchannels in a copper cold-plate base, above a thermal interface, a case thermocouple, the silicon die and a heater. A dashed control volume encloses case to coolant, with flow, temperature and pressure-drop sensors at inlet and outlet.
The control volume runs from case to coolant and is measured the same way for both modes on the same mount.

Every stage reports the same four metrics: thermal resistance, heat capture, pumping power (ΔP × V̇) and exergy destruction.

  1. Package bench

    One thermal test vehicle. The single-phase cold plate and the two-phase evaporator swap on one mount, with a full-factorial sweep of power, flow and inlet temperature.

    Cooling mode becomes the only variable, as in Lee et al. (2026).

  2. Rack-slice

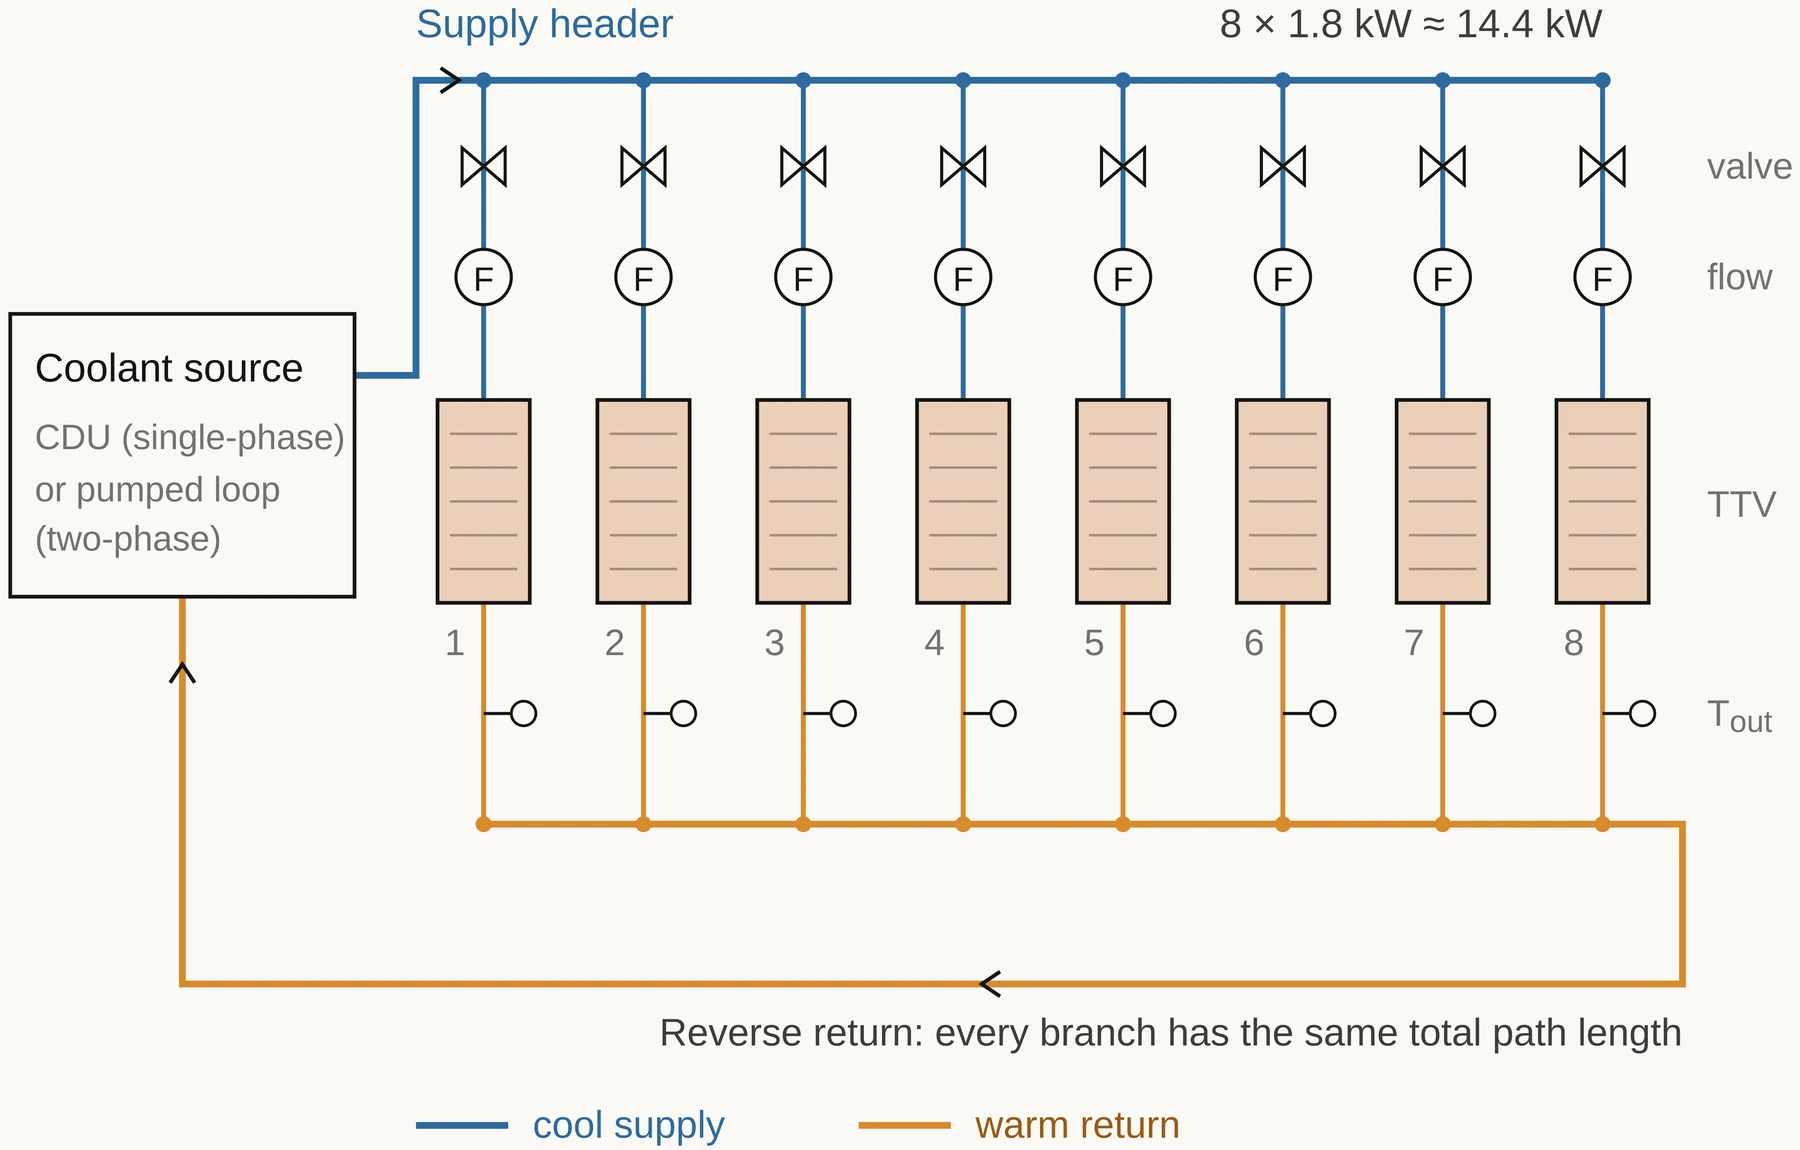
    Eight test vehicles on parallel cold plates sharing supply and return headers, up to 1.8 kW each (about 15 kW).

    Reproduces uneven branch flow, the rack-scale failure mode in Heydari et al. (2024).

  3. Full-rack validation

    One NVL72-class production rack (180 to 220 kW) at an industry partner, same sensors, live workloads.

    Tests the bench-derived P* map under real facility conditions.

I ruled out CFD alone because it cannot yet predict dryout onset at these geometries, and field data alone because it cannot isolate cooling mode.

Resources

Two coolant loops, 15 kW of test load, one partner rack, no human participants.

What the experiment would need. None of it has been booked or agreed; this is the request the proposal makes.

ResourceRequirementSpecification
Test articles8 thermal test vehicles0.6 to 1.8 kW each; embedded thermocouples; patterned heaters
Cooling hardwareSingle-phase cold plates and CDU; two-phase evaporators and pumped loopPG25 water-glycol; low-GWP, PFAS-free dielectric refrigerant
InstrumentationCoriolis flow meters, ΔP transducers, thermocouples, RTDs, power analyser1 Hz acquisition, calibrated before commissioning
FacilityA thermal laboratory bayAbout 20 kW three-phase supply, chiller, ventilation, refrigerant recovery
Field siteA partner data centre, to be securedOne NVL72-class rack (180 to 220 kW); telemetry under NDA
SoftwarePython (SciPy, CoolProp), ExcelOpen repository for non-confidential data and code
People and timeSupervisor, lab technician, partner engineer12 months: bench 0 to 5, rack-slice 5 to 9, field 9 to 11, write-up 11 to 12
Ethics
Human research ethics clearance is not required: no human or animal participants.
Still required
Lab risk assessment for high-power electrical work and pressurised refrigerant. Licensed refrigerant handling. A PFAS-free fluid, since 3M exited PFAS manufacturing at the end of 2025. Partner data under NDA, with funding and conflicts disclosed, and non-confidential data published openly.

Evaluation methods

270 controlled runs, an 8‑branch rack-slice, then a live rack.

  1. CommissionHeat balance closes within ±5%
  2. Test matrix2 × 5 × 3 × 3 × 3 = 270 randomised runs
  3. Collect1 Hz; steady when dT/dt < 0.1 °C/min
  4. AnalyseFit case temperature against power and flow; P* with 95% confidence intervals
  5. Scale upRack-slice, then a live rack
Rack-slice schematic: a coolant source feeds a blue supply header with eight branches, each with a valve, a flow meter and a thermal test vehicle, returning through an orange reverse-return header so every branch has the same path length.
Eight branches at 1.8 kW each (about 14.4 kW). A reverse-return header gives every branch the same total path length.
Rack-slice acceptance
Every branch within ±10% of mean flow, and 100 hours held at 90% of predicted dryout.
Live rack
Predicted against measured case temperature under real workloads.
Hypothesis test
Supported if the two-phase P* interval lies above the single-phase interval at equal or lower pumping power: a paired comparison with a two-way ANOVA, mode × power.

Preliminary data analysis and reflection

On synthetic data, two-phase resistance sits well below single-phase until dryout, then jumps 43%.

Synthetic dataThese 240 runs come from a dataset I generated in Assessment 2 from textbook correlations, with 2 °C of random noise. They test the analysis pipeline, not the physics. Hover or focus a point for its run details.

Single-phase runs hotter per watt; 12 runs exceed 90 °C

  • Single-phase (n = 120)
  • Two-phase (n = 120)
  • Single-phase above 90 °C
  • Linear trend
Scatter of case temperature against GPU power for 240 synthetic runs. Single-phase rises about 0.032 °C per watt and 12 runs exceed the 90 °C limit, all above 1,580 W. Two-phase rises about 0.015 °C per watt and none exceed it.

How to read: a steeper trend runs hotter per watt (R² = 0.68 single-phase, 0.27 two-phase).

Two-phase resistance is lower until dryout, then jumps

  • Two-phase, no dryout (n = 100)
  • Two-phase, dryout (n = 20)
  • Single-phase mean
Scatter of two-phase thermal resistance against GPU power. Without dryout it falls with power along a power-law trend, averaging 34% below the single-phase mean of 0.0292 K/W. The 20 dryout runs jump 43%, back up near the single-phase line.

How to read: lower is better cooling. Before dryout, two-phase averages 0.0194 K/W, 34% below single-phase. Dryout lifts it 43%, to 0.0276 K/W.

Supports the direction
The analysis separates the two modes and resolves a dryout step, which is exactly what the experiment must measure.
Contradicts the literature
On real hardware, two-phase resistance was 8.7% higher (Lee et al., 2026). My generator assumed two-phase wins on resistance; measured hardware shows the opposite. That is the strongest argument for the experiment.
Limitations
Synthetic and circular; no pumping power; one GPU; dryout onset uncalibrated.

Outcomes and benefits

Deliverable: a measured map of where single-phase stops being sufficient.

GPU power
Map of coolant flow rate against inlet temperature with contours of the single-phase power limit P* at a 90 °C case limit. The shaded red zone is where single-phase cannot hold 90 °C for the selected GPU power.

Preview from the fit to the synthetic data: Tcase − Tin = aP + bP·V̇−0.8, with a = 0.0122 and b = 0.0276 K/W. Worst case (1 L/min, 45 °C): P* = 1.13 kW single-phase, 1.66 kW two-phase.

Outcomes

  1. An open benchmark dataset: both modes on one boundary, at bench, rack-slice and rack scale.
  2. A mode-selection map: measured P*(V̇, Tin) for each mode, with 95% confidence bounds.
  3. Design limits: dryout margin and branch flow-split tolerance for parallel cold plates.
  4. A peer-reviewed paper with open analysis code.
Operators
Cooling architecture chosen on measured limits, not vendor claims.
Engineers
Validated margins for cold-plate and manifold design above 1 kW per GPU.
Energy and environment
Lower pumping energy, warmer-water heat reuse, PFAS-free fluids.

Questions I prepared for

Each answer states the trade-off openly.

Your synthetic data was generated from the relationships you then found. What is it worth?
It validates the analysis pipeline, not the physics. It showed the method separates the two modes, resolves a dryout step, and that a linear model is wrong for two-phase. It also exposed the contradiction with Lee et al. (2026), which is the strongest argument for the experiment.
Why not test a full 200 kW rack in the lab?
Cost and facility power. Heydari et al. (2024) show the rack-scale failure mode is flow distribution across parallel branches, which eight branches reproduce at real per-GPU heat flux. Stage 3 then validates on one production rack. Extrapolating from 8 to 72 branches is the main stated limitation.
Why not CFD?
Two-phase CFD cannot yet reliably predict dryout onset at these geometries. Experiment first; CFD is then useful for interpreting manifold flow distribution.
How will you detect dryout?
A step rise and growing fluctuation in wall and case temperature at constant power, cross-checked against exit vapour quality from the energy balance, with a sight glass at the evaporator outlet.
Which refrigerant?
A low-GWP dielectric screened against PFAS restrictions. Classic HFE fluids such as HFE-7100, used by Lee et al., are affected by 3M exiting PFAS manufacturing. Fluid choice is an ethical and supply-chain decision as well as a thermal one.

Conclusion

Single-phase is proven today. This project measures where it stops being enough.

Gap
No study compares single- and two-phase cooling on one boundary above package scale.
Method
One control volume at bench, rack-slice and full-rack scale: 270 controlled runs, endurance and field validation.
Contribution
The first boundary-consistent P* map for direct-to-chip cooling.
Impact
Evidence for cooling-architecture decisions as AI racks pass 200 kW, where thermal management already draws about 40% of data-centre electricity (Wu et al., 2025).
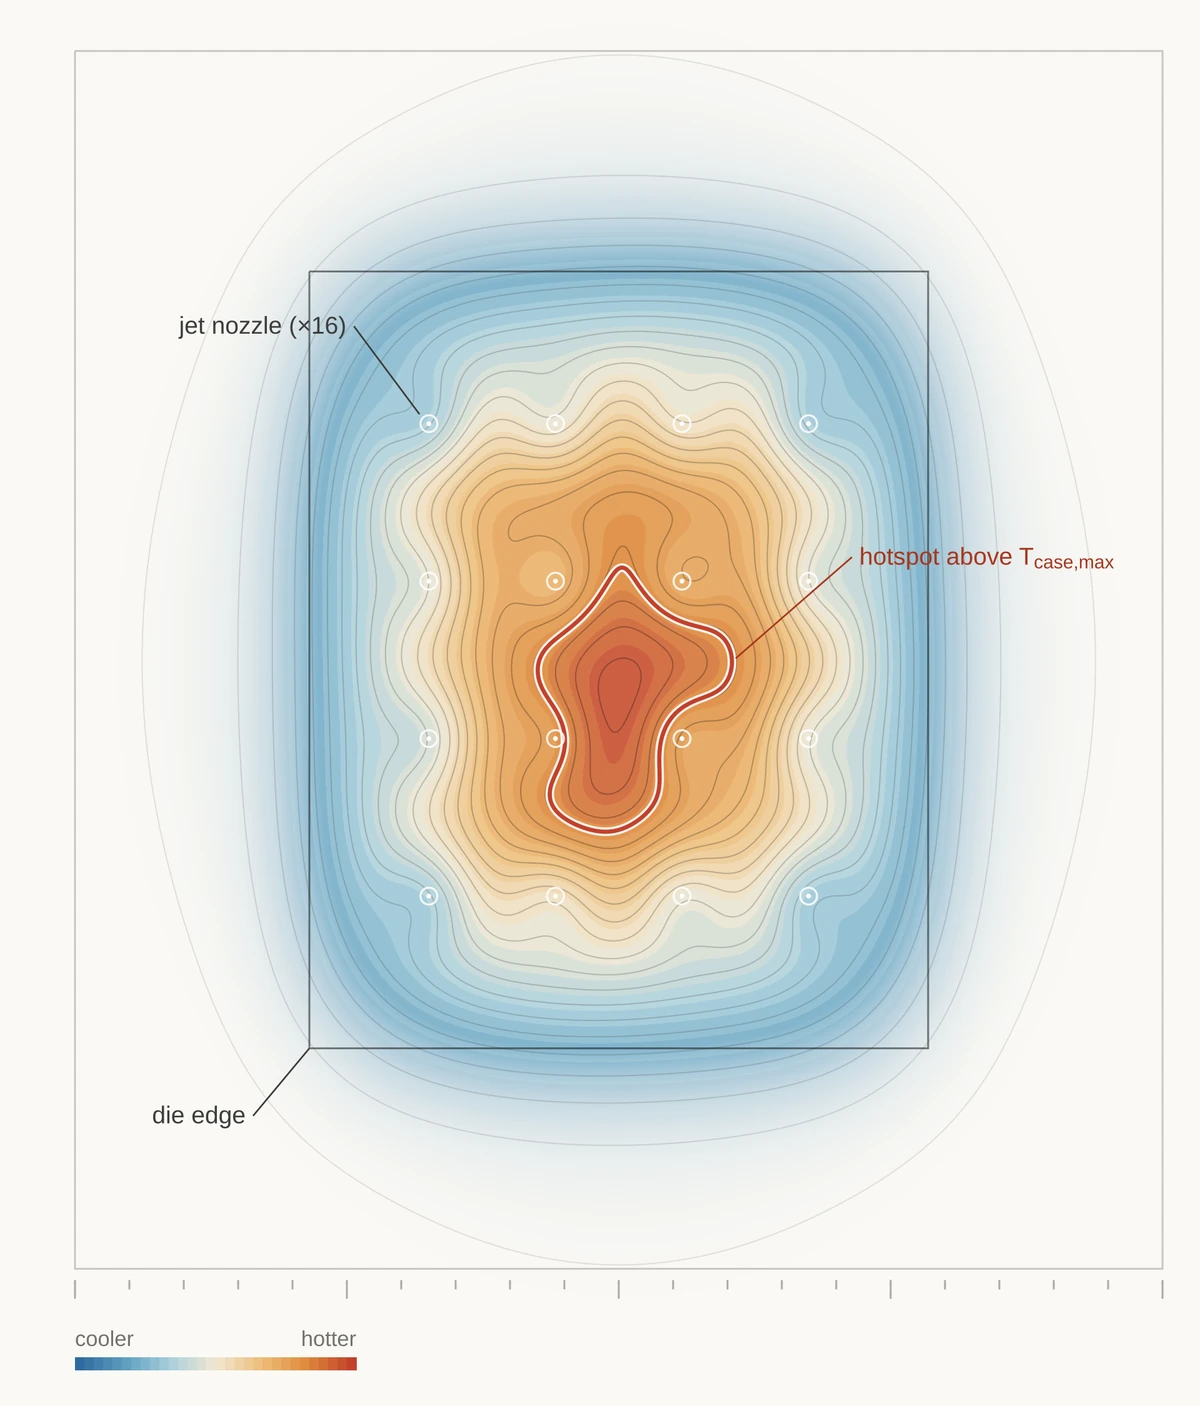
A second illustrative case-temperature map under the jet array, with an irregular hotspot outlined in red.
Illustrative: a hotspot above Tcase,max under the jet array.

References

Sources

  • 3M. (2022, December 20). 3M to exit PFAS manufacturing by the end of 2025 [Press release]. news.3m.com
  • Chu, W., Patel, D., & Nishball, D. (2026, February 25). Vera Rubin: Extreme co-design, an evolution from Grace Blackwell Oberon. SemiAnalysis. newsletter.semianalysis.com
  • Drummond, K. P., Back, D., Sinanis, M. D., Janes, D. B., Peroulis, D., Weibel, J. A., & Garimella, S. V. (2018). A hierarchical manifold microchannel heat sink array for high-heat-flux two-phase cooling of electronics. International Journal of Heat and Mass Transfer, 117, 319-330. doi.org/10.1016/j.ijheatmasstransfer.2017.10.015
  • Ferguson, K. (2026). Synthetic single- and two-phase direct-to-chip cooling dataset (n = 240) [Unpublished dataset]. EGH404 Assessment 2, Queensland University of Technology.
  • Heydari, A., Gharaibeh, A. R., Tradat, M., Soud, Q., Manaserh, Y., Radmard, V., Eslami, B., Rodriguez, J., & Sammakia, B. (2024). Experimental evaluation of direct-to-chip cold plate liquid cooling for high-heat-density data centers. Applied Thermal Engineering, 239, 122122. doi.org/10.1016/j.applthermaleng.2023.122122
  • Incropera, F. P., DeWitt, D. P., Bergman, T. L., & Lavine, A. S. (2007). Fundamentals of heat and mass transfer (6th ed.). John Wiley & Sons.
  • Lee, I., Cho, H., Kim, S., Kim, J., & Nam, Y. (2026). High efficiency single and multi-phase direct liquid jet-impingement cooling for heterogeneous packaging. Energy Conversion and Management, 348, 120665. doi.org/10.1016/j.enconman.2025.120665
  • Morse, R. W., Moreira, T. A., Chan, J., Dressler, K. M., Ribatski, G., Hurlburt, E. T., McCarroll, L. L., Nellis, G. F., & Berson, A. (2021). Critical heat flux and the dryout of liquid film in vertical two-phase annular flow. International Journal of Heat and Mass Transfer, 177, 121487. doi.org/10.1016/j.ijheatmasstransfer.2021.121487
  • Wu, Z., Xiao, W., He, H., Wang, W., & Song, B. (2025). Jet-enhanced manifold microchannels for cooling electronics up to a heat flux of 3,000 W cm−2. Nature Electronics. doi.org/10.1038/s41928-025-01449-4

All projects